2013 - 2014 : Where do we go next ?
INTRODUCTION
Our project can be divided into four phases: one for data assimilation, a second one for analysis, the third one for visualization and the last one for modeling.
Throughout the weeks, we have benefited of different lectures delivered by speakers invited by our academic leader T. Carletti.
The main subjects was introduced by Bruno Gonçalves, UMarseille, (5 lectures on "data collection") and Anastasios Noulas, Cambridge (10 lectures on "data analysis and visualization").
Beside that, we have also attended to the following short modules:
- "Introduction to Python", Pierre de Buyl
- "La protection des données personnelles", Cécile de Terwangne
- "Diffusion processes on complex networks", Floriana Gargiulo
- "Exploitation de grandes bases de données: techniques d'optimisation en assimilation de données pour les prévisions météorologiques et océanographiques", Annick Sartenaer
- "High Performance Computing", Frédéric Wautelet
We have also had the support of several faculty members and three PhD Assistant to follow our progress.
DATA COLLECTION
The first step of this work is to collect data from Twitter and Foursquare. Both applications are necessary since Foursquare data are private but can be obtained when shared via Twitter which is completely public.
Like previously mentioned, we have had the chance to meet Bruno Gonçalves who introduced us to data collection techniques and especially to Twitter and Foursquare APIs.
In our work, we were interested in comparing cities. In a first place we have chosen to examine the case of Namur which we know well. After that we have chose to analyze four cities from the European Union (Brussels, Paris, Barcelona and Berlin) and three others (New York, Moscow and Sydney).
We have collected two types of data. The first one only concerns venues and could be obtained from Foursquare without Twitter. The second data set is about people mobility and contains their checkins.
Data concerning venues
Foursquare data has to be private when it concerns its users for obvious reasons but there is no such need when the data only concerns places. So, we could collect every venue registered on Foursquare and situated within a certain perimeter. This research have taken a while and we have faced several issues due to Foursquare restrictions that we detail in our report.
The number of places being quite big, the data gathering have taken a while and we were able to do it only for three cities: Namur, Brussels and Paris.
Data concerning people
To collect data about people mobility, we have first searched for a set of users to follow. In order to do that, we have collected all tweets shared during a week in a particular geographical area. We have then kept only those related to a Foursquare checkin and we have added each user involved to our set. Afterwards we have asked twitter for the timeline (limited to 2013 and 2014) of every user mentioned in our set.
We have done this for every city mentioned above but we only have the timelines limited to 2014 for some of them.
ANALYSIS
In the second step, we have tried to understand the human mobility. We have gathered a big amount of data about the places that people visit during the day to answer to this question. We have analyzed data concerning people movement. Are women different than men about the places they visit? What category is the most popular per hour/day? How often do people check in? These are the type of questions that would be answered.

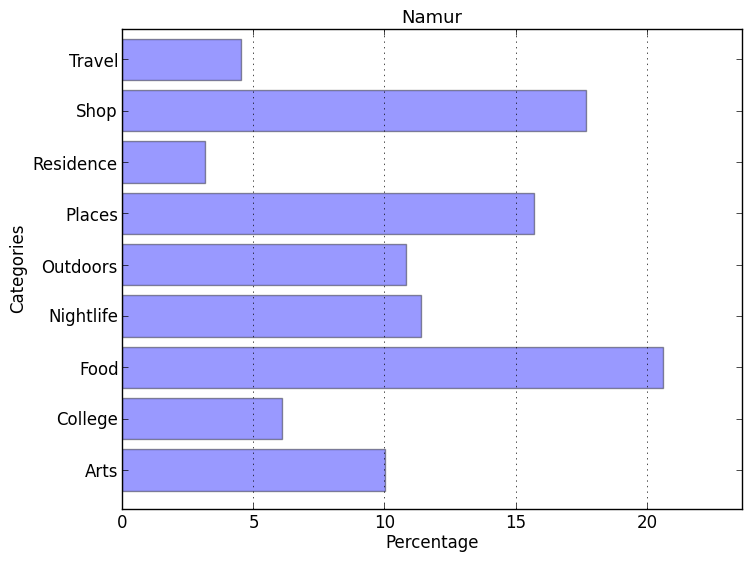
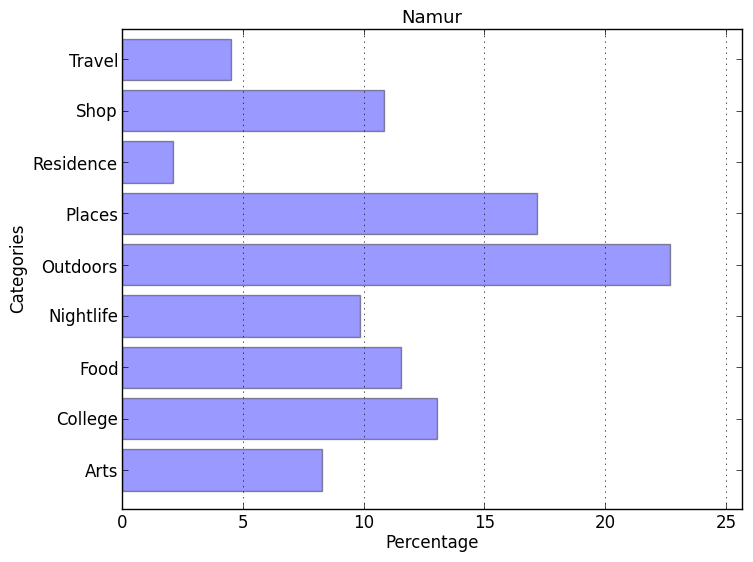
These figures give you an example of analysis. The figure on the left represents the percentage of checkins made in each category on 4 311 checkins. We notice that users make a lot of checkins in "Outdoors & Recreation" and "Professional & Other Places" categories. Knowing that 509 places exist, the second figure on the right represents the percentage of venues in each category in Namur. We notice that most venues where users check in are listed in descending order in "Food", "Shop & Services" and "Professional & Other Places" categories.
These representations have a totally different look. Indeed, there are few places in "Outdoors & Recreation" category but users check in there a lot. On the contrary, there are many places in "Food" category but users make fewer checkins in restaurants. These observations can be explained by the fact that in restaurants, people eat and do not think to check. On the other hand, in parks, people do nothing and have all the time to make a check.
VISUALIZATION
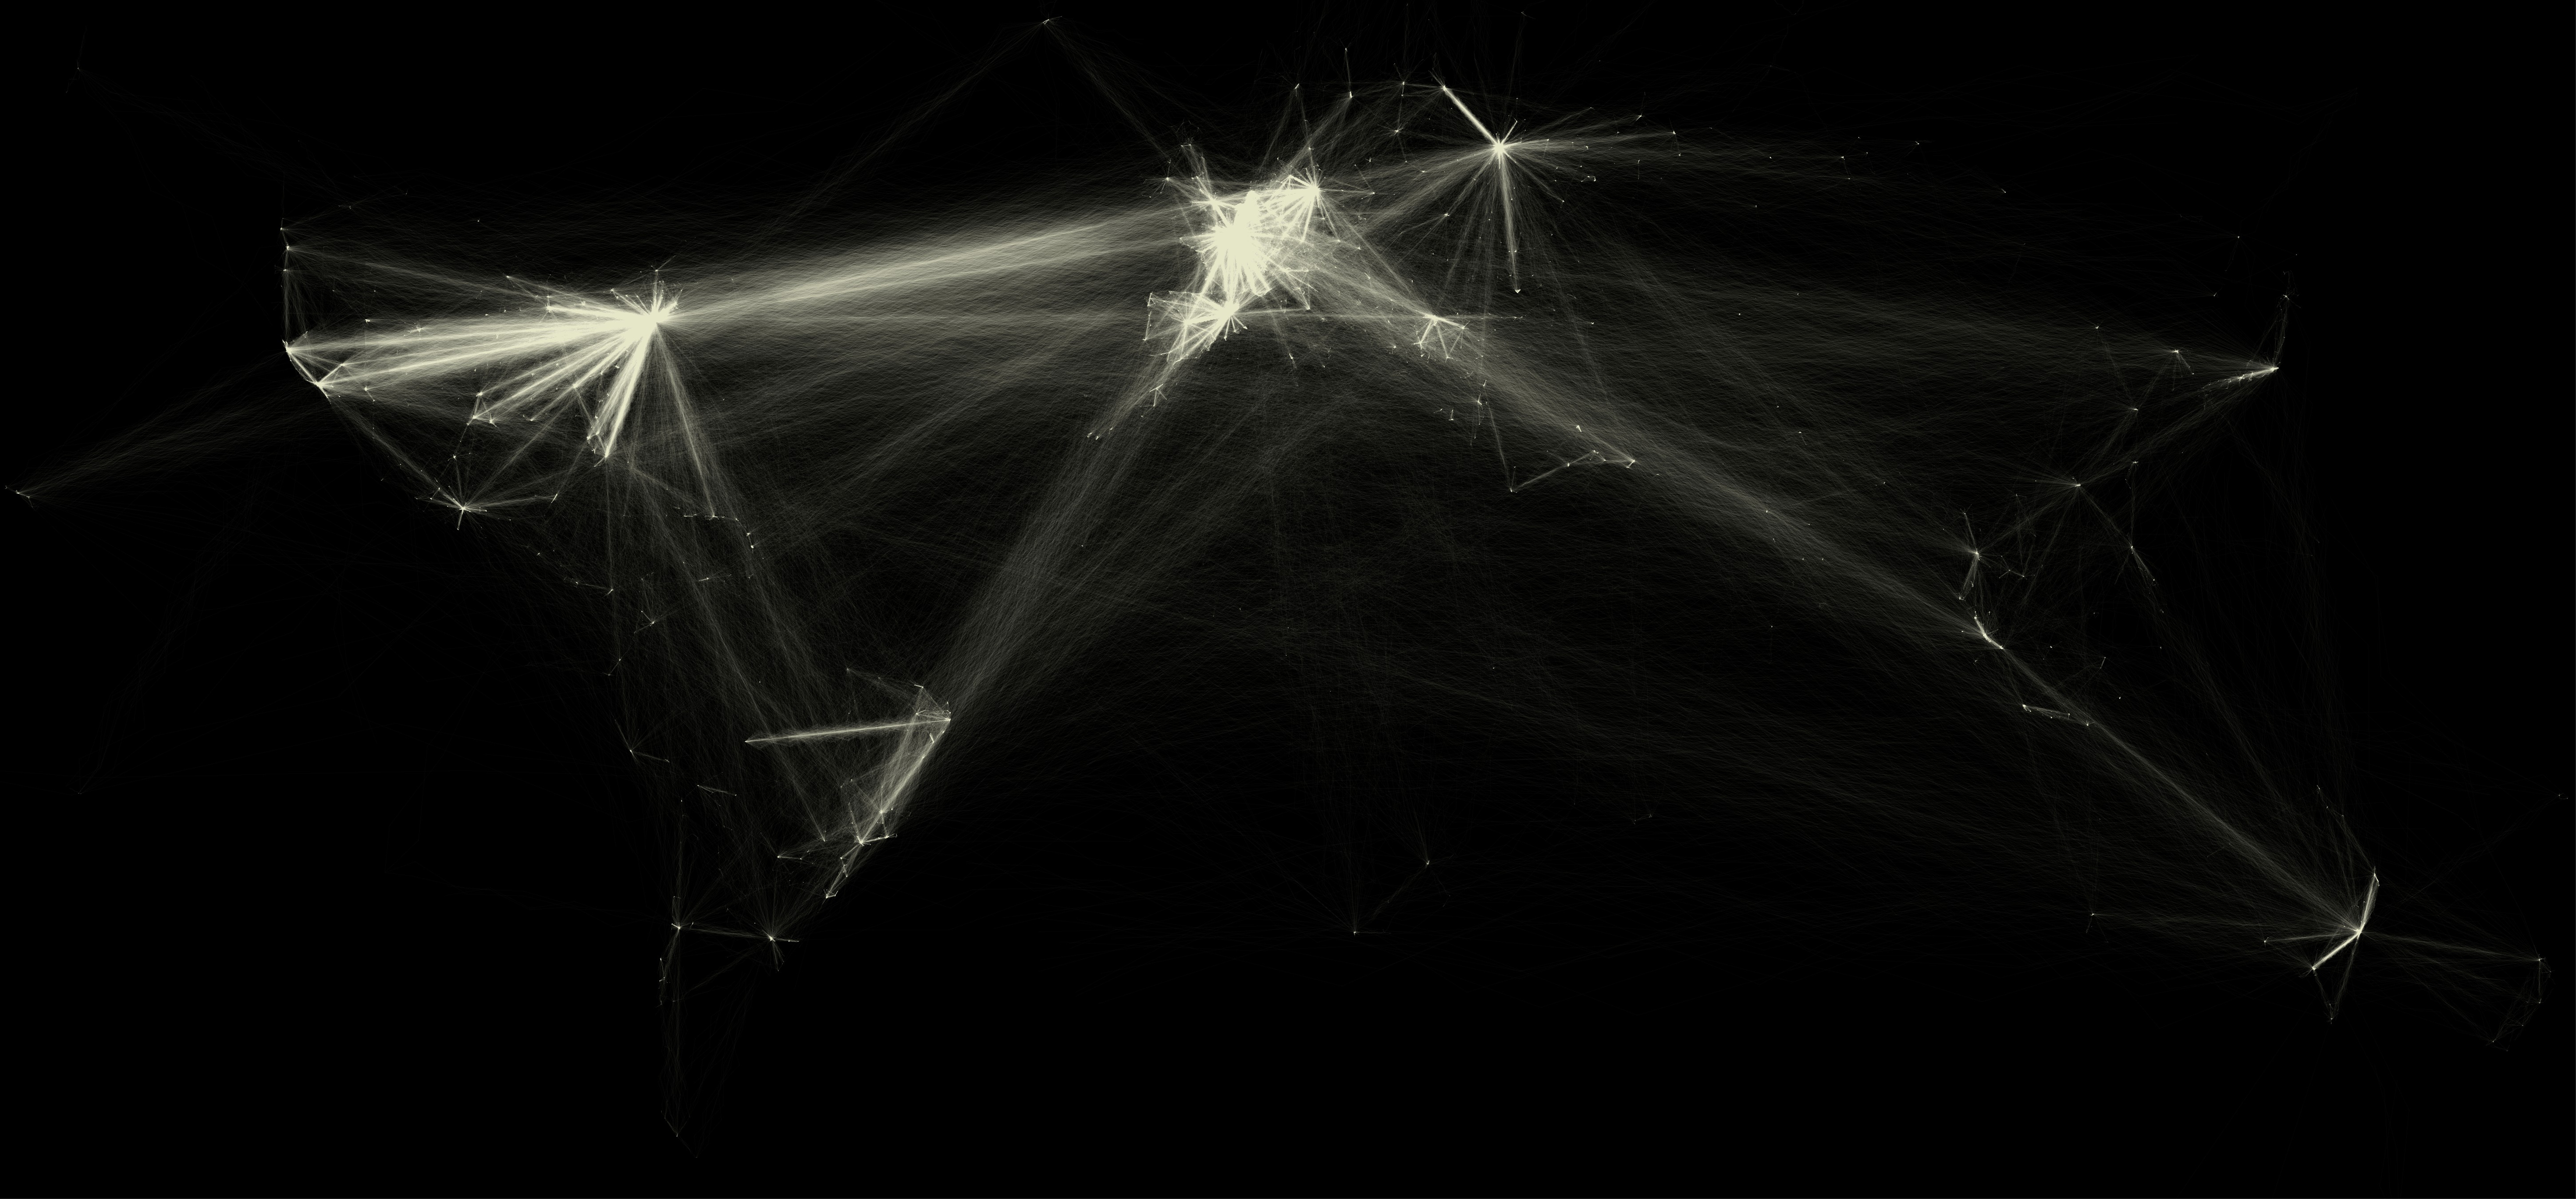
After collecting data and making a lot of statistical analyses, we make some visualizations thanks to the program Processing. These visualizations represent the behavior of users from Foursquare and Twitter. In other words, we represent the popularity of venues by category, the category of the areas of the city and the travel of people. To have an idea of our data, we have represented the travel of people in our data set by with links. We can visualize world and in particular Europe.
We have also made an animation showing where and when people checked in. We put all our data on a world map at their specific spot of creation. They also appear right at the moment of the day they where created. This produce the following video :
MODELING
In the last step of this work, we have tried to build some models to predict the place where we go next. Discrete choice and genetic algorithm have been used to predict the category of the next venue, while bipartite network has been used to predict a set of specific places for the next checkin.
First, we have created two discrete choice models: one with memory (which takes the categories of the previous and current venues into account) and one without memory (which only takes the category of the current venue into account). As the prediction rates are better for the model without memory and the number of parameters is too high for the one with memory, we have decided to keep the discrete choice model without memory.
In conclusion, we have compared the best discrete choice model and the genetic algorithm model thanks to some prediction measures and the execution time. We have decided to favour the discrete choice model without memory by proposing three categories to the user. The predicted category is determined by three variables: the category of the current venue, the main category and the hour of the next checkin. The exact category belongs to the set composed of these three proposed categories in about 66% of cases.
So we have combined the best discrete choice model with the bipartite network model. For example, a user is in a venue belonging to "Travel & Transport" category and he wants to go to another venue at 8 am. His main category is also "Travel & Transport". With these variables, the discrete choice model proposes three categories: "Travel & Transport", "Outdoors & Recreation" and "Food". With these categories, the bipartite network model predicts a set of venues. For example, the venues "Brussels South Charleroi Airport", "Miami Beach" and "Burger King".
ABOUT US
Hi,
Currently studying Mathematics at the University of Namur, we are a group of ten students coming from the four corners of Wallonia. Our group is composed of eight girls and two boys and is very heterogeneous. This particularity can both be a great advantage for our project and cause us complications. Indeed, our different ways of thinking and skills allow us to have a broad perspective on this project but also risk to disperse our efforts in diversification and will also be a challenge regarding the overall organization.
If you want to get in touch, feel free to contact us by sending an email to master2-spec@math.unamur.be.


